Charting Expiration Waves: Aligning Purchases with Market Cycles for Portfolio Growth
Avery Schmid · Aug 18, 2026
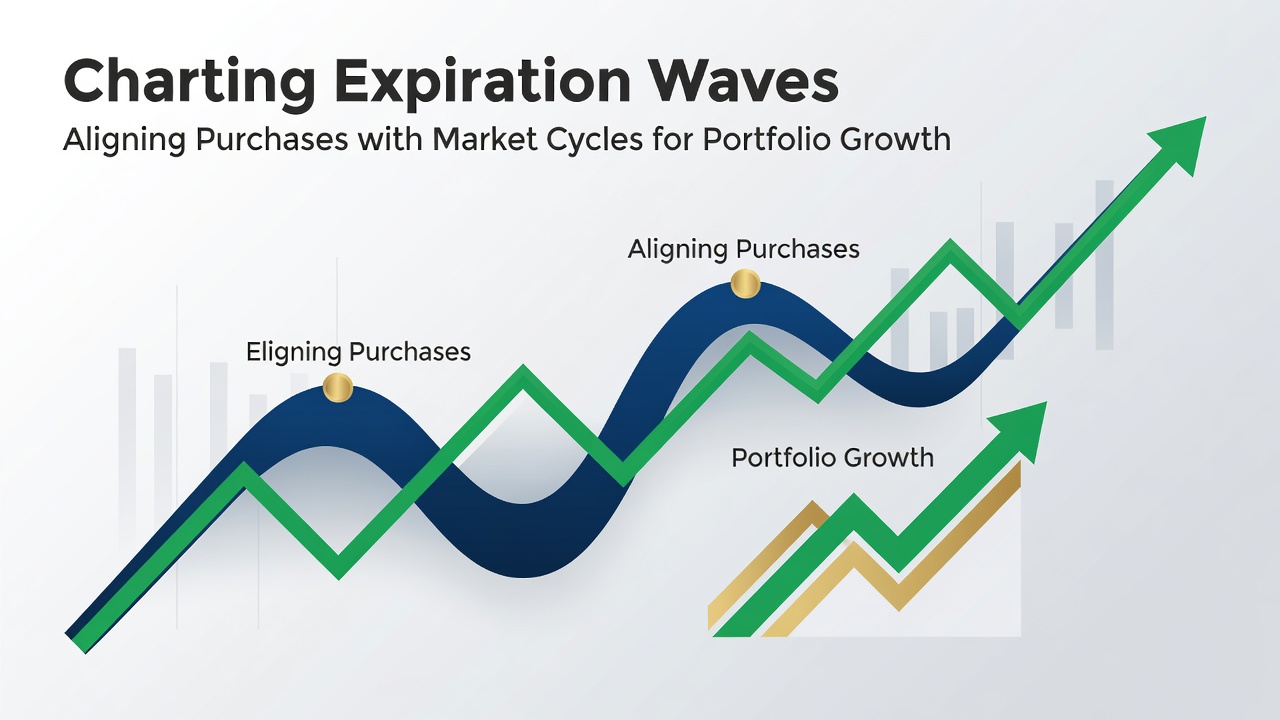
Charting Expiration Waves: Aligning Purchases with Market Cycles for Portfolio Growth
Domain expiration patterns follow recurring waves that investors track through registry data releases and historical renewal statistics, and these cycles intersect with broader economic indicators such as interest rate shifts and technology sector funding rounds. Observers note that large batches of domains reach expiration during specific quarterly windows, creating measurable surges in available inventory that align with seasonal business reporting periods.
Mapping Expiration Timing Across Registries
Registries publish daily deletion lists that reveal clusters of expirations concentrated around the end of calendar quarters, and analysts compile these lists into wave charts that highlight predictable volume spikes. Data from major registries shows that .com and .net names often follow a 90-day renewal grace period before entering redemption, which produces consistent monthly patterns that repeat year after year. Those who monitor these lists combine deletion volumes with renewal rate reports to forecast when supply will increase relative to demand.
August 2026 data releases are expected to reflect continued growth in internationalized domain expirations, particularly from European and Asian registries adjusting to updated WHOIS verification rules. This timing coincides with mid-year financial reporting cycles that influence institutional allocation decisions in digital asset portfolios.
Connecting Economic Indicators to Domain Liquidity
Market cycles in equity and venture capital funding directly affect the capital available for domain acquisitions, since many portfolio managers treat aged names as alternative assets that correlate loosely with technology stock performance. When broader markets experience contraction phases, auction participation tends to decline while buy-it-now prices stabilize or drop, creating entry points for buyers who have tracked expiration waves in advance. Conversely, expansion phases increase competition at drop-catch services and push average sale prices higher across aged inventory.
Researchers at academic institutions have examined these correlations using public transaction datasets, finding that domain price elasticity responds to macroeconomic variables with a lag of approximately two to three quarters. Portfolio managers who overlay expiration calendars onto economic forecasts can therefore time bulk purchases during periods when capital deployment slows across competing asset classes.
Valuation Models That Incorporate Cycle Data
Quantitative approaches combine historical sales multiples with current wave volume projections to generate bid thresholds that adjust automatically as market conditions shift. These models incorporate metrics such as average time-to-sale for comparable names, redemption fee structures, and backorder competition levels reported by registrars. When expiration waves coincide with tightening credit conditions, the models lower recommended acquisition ranges to maintain target internal rates of return.
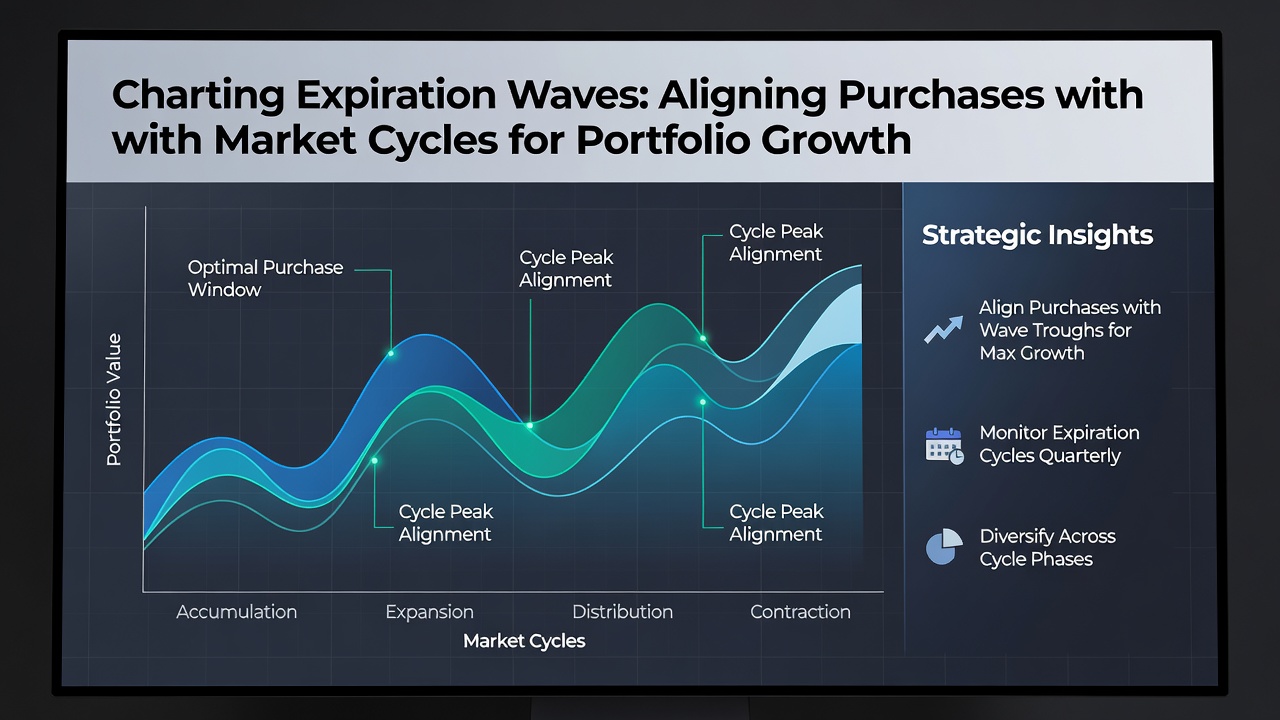
Portfolio rebalancing occurs when projected wave volumes exceed historical averages by more than one standard deviation, prompting managers to increase cash reserves ahead of anticipated supply increases. This approach reduces exposure during peak competition periods and preserves liquidity for selective entries when prices stabilize.
Registry Policy Changes and Their Cycle Effects
Policy updates from bodies such as the Internet Corporation for Assigned Names and Numbers alter grace periods and verification requirements, which in turn shift the precise timing of deletion waves across top-level domains. European registry operators have introduced staggered renewal windows in recent years, spreading expirations more evenly and reducing the amplitude of individual waves. Investors who integrate these policy calendars into their forecasting tools gain earlier visibility into inventory changes that affect acquisition costs.
Similar adjustments appear in reports from the Australian Communications and Media Authority, where updates to .au namespace rules have produced measurable changes in secondary market velocity. These regional variations create opportunities for diversified portfolios that allocate across multiple extensions rather than concentrating in a single namespace.
Implementation Through Systematic Tracking
Organizations maintain internal dashboards that merge deletion lists, economic indicator feeds, and transaction histories into unified views updated daily. Automated alerts flag upcoming wave peaks that cross predefined thresholds relative to trailing twelve-month averages. Portfolio adjustments then follow documented rules that scale position sizes according to the projected supply-demand balance.
Case examples from institutional digital asset teams show that consistent application of these timing protocols has produced measurable improvements in average acquisition cost per name across multi-year holding periods. The approach relies on transparent data sources rather than discretionary timing judgments.
Conclusion
Expiration wave analysis combined with macroeconomic cycle awareness provides a structured framework for scheduling domain purchases. Portfolio managers who maintain updated calendars and valuation models tied to public registry statistics and economic reports can align acquisition activity with periods of favorable supply and pricing conditions. Ongoing policy developments across multiple jurisdictions continue to shape the exact shape of future waves, requiring regular recalibration of forecasting inputs.